

Making scientific data mapping easier to configure
Researchers using Platforma struggled to find relevant metadata and understand where they could use it in a visualization. After reviewing recordings of user meetings, I proposed and designed a shared mapping interface that grouped variables by biological meaning and showed compatibility before dragging began.
- Product
- Platforma, MiLaboratories
- My role
- Product Designer responsible for the interaction model, UI, and implementation review
- Scope
- Shared data-mapping interface across visualization blocks
- Design
- Approximately 2–3 weeks alongside other work.
- Delivery
- Metadata grouping and compatibility highlighting shipped in the next release
Helping researchers choose what a visualization shows
Platforma helps scientists analyze biological data through connected analytical applications called blocks. Its data-mapping interface lets them assign variables to visualization controls such as color, size, highlighting, and grouping.
The same interface appeared across all visualization blocks, although the available metadata and controls varied. Researchers needed to find the information relevant to their question and understand where it could be applied.
Two problems in the existing experience
I reviewed recordings of user meetings and saw researchers struggle with a large, unsorted metadata list. Finding the right variable required scanning through options without a meaningful structure.
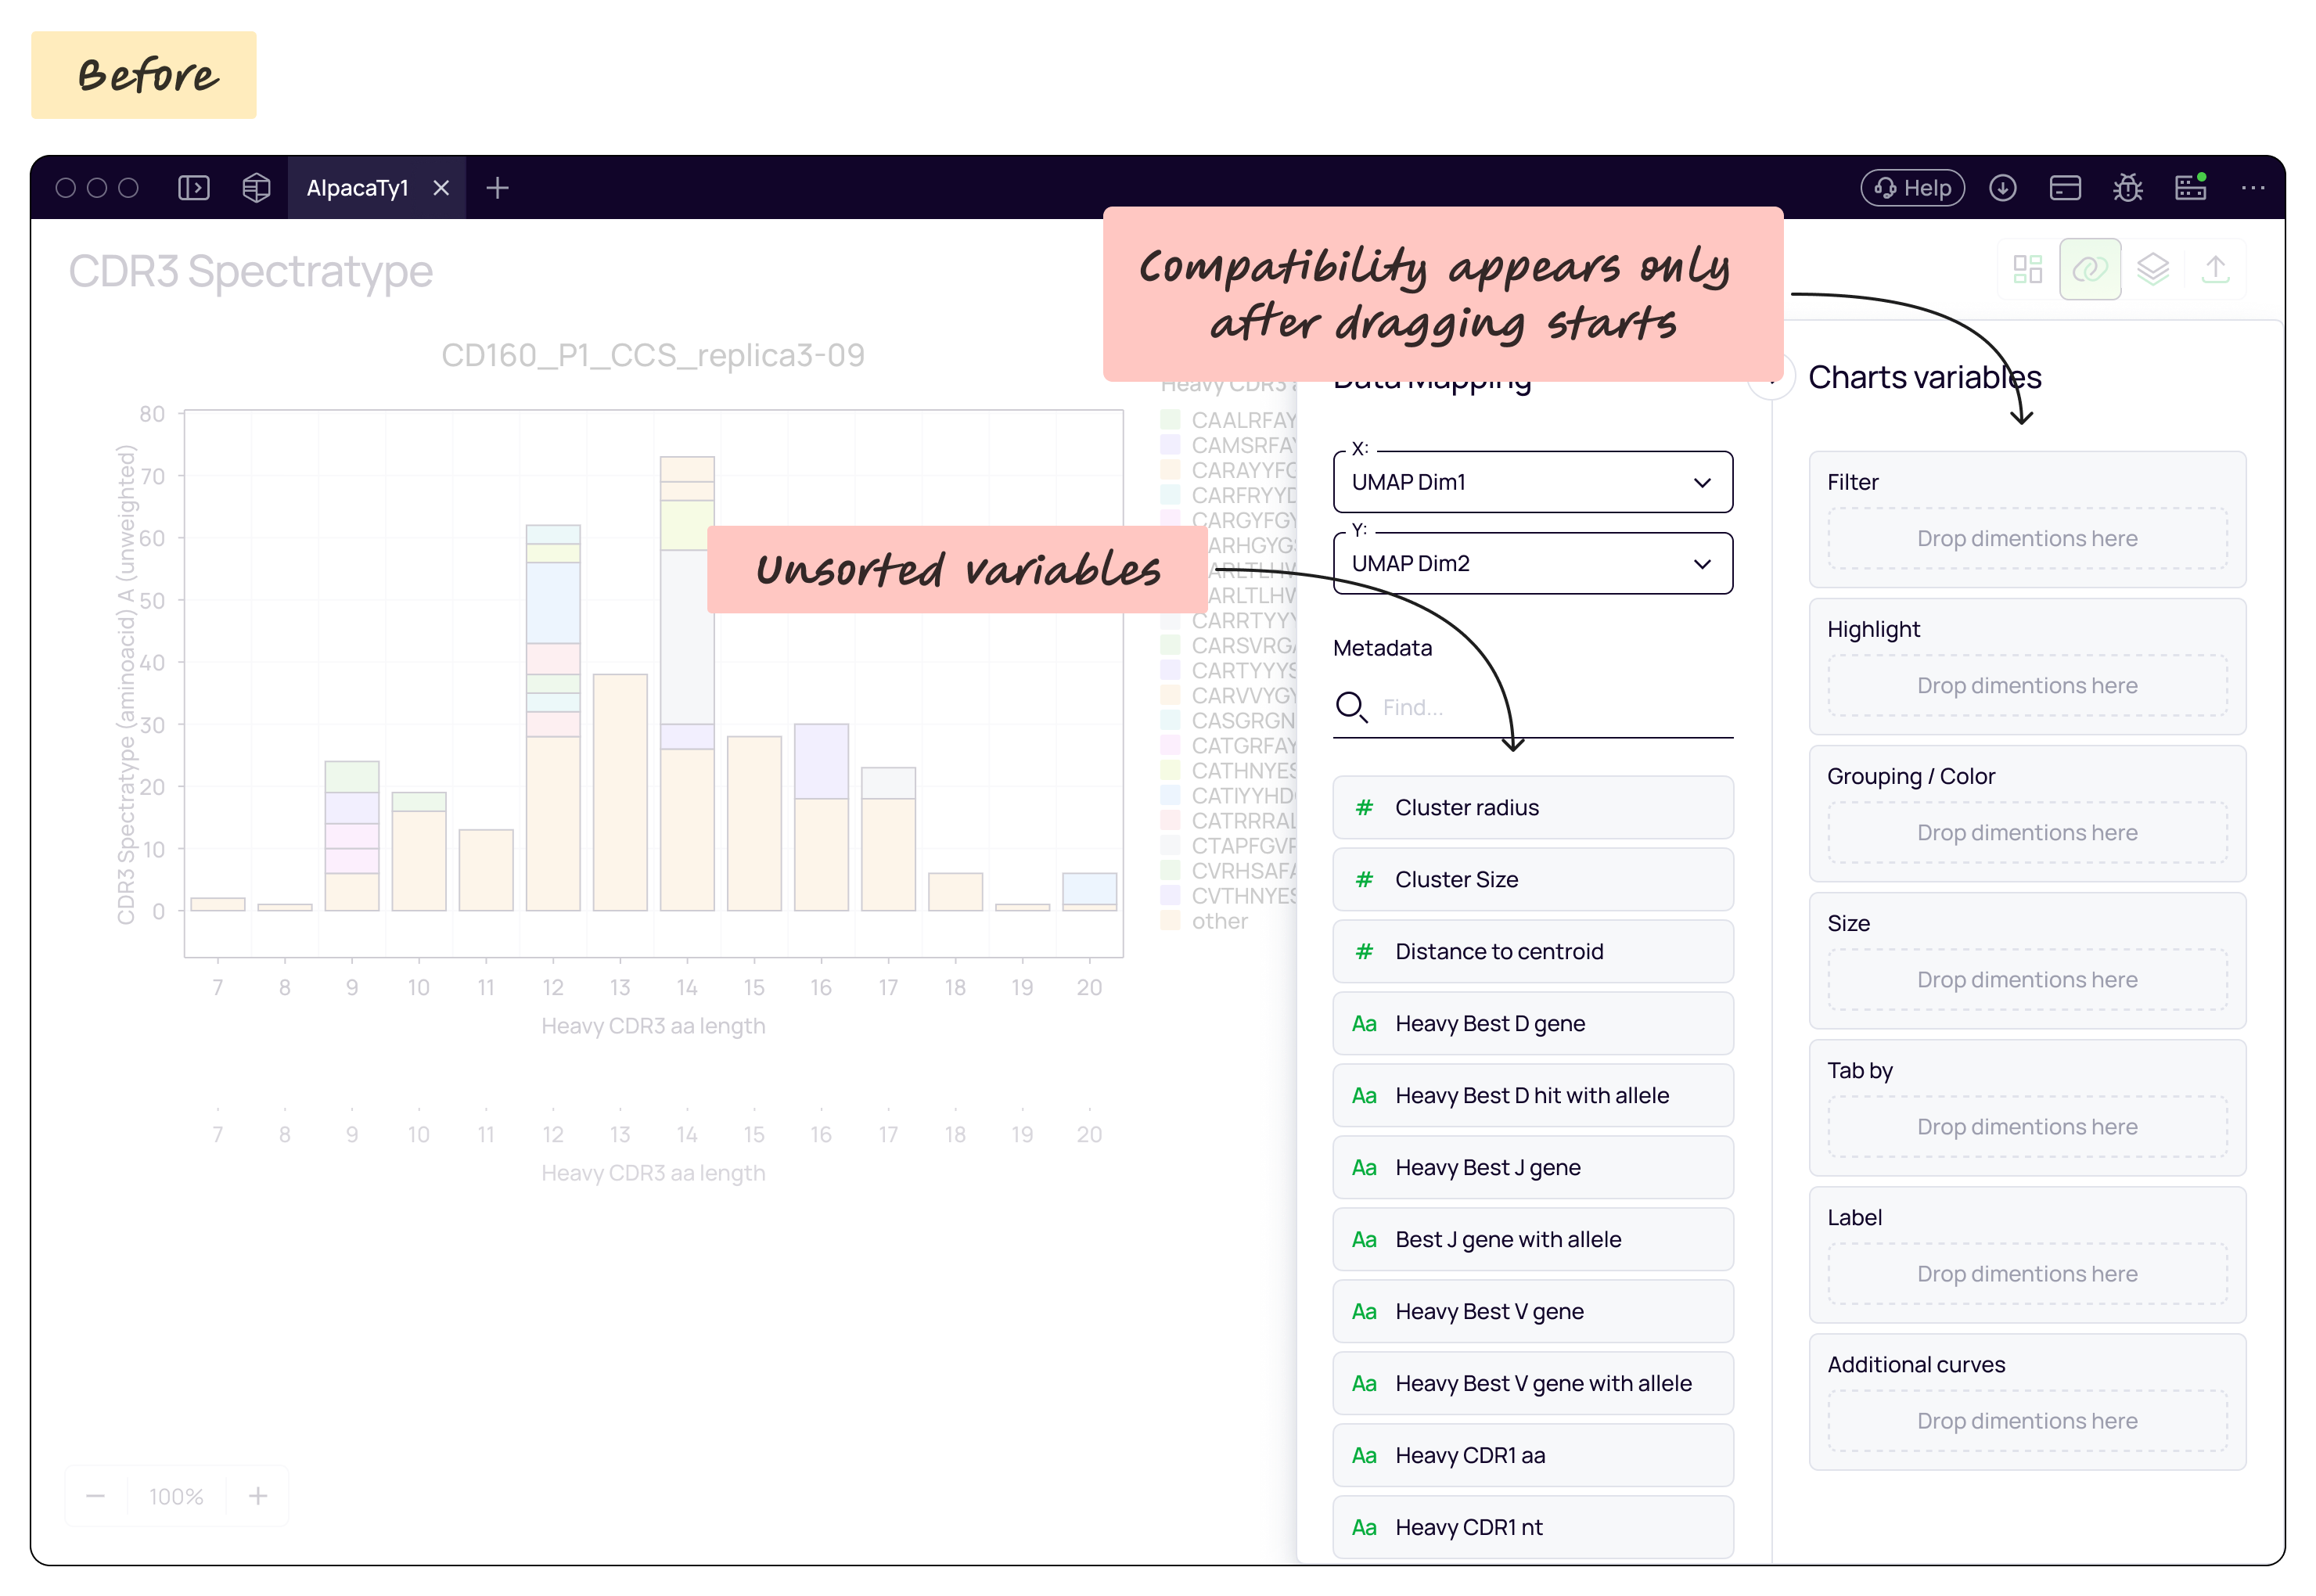
Compatibility was also difficult to anticipate. Incompatible inputs became disabled only after a user began dragging a variable. The interface provided feedback, but users had to initiate an action to discover its restrictions.
I raised these observations with the CEO and internal bioinformaticians. We agreed to prioritize metadata discovery and compatibility because both affected multiple visualization workflows.
Organizing variables by biological meaning
I designed a grouped metadata list to give researchers a more structured way to browse. Categories included Sequence & Structure, V(D)J Annotation, SHM & Maturation, and Clustering & Diversity.
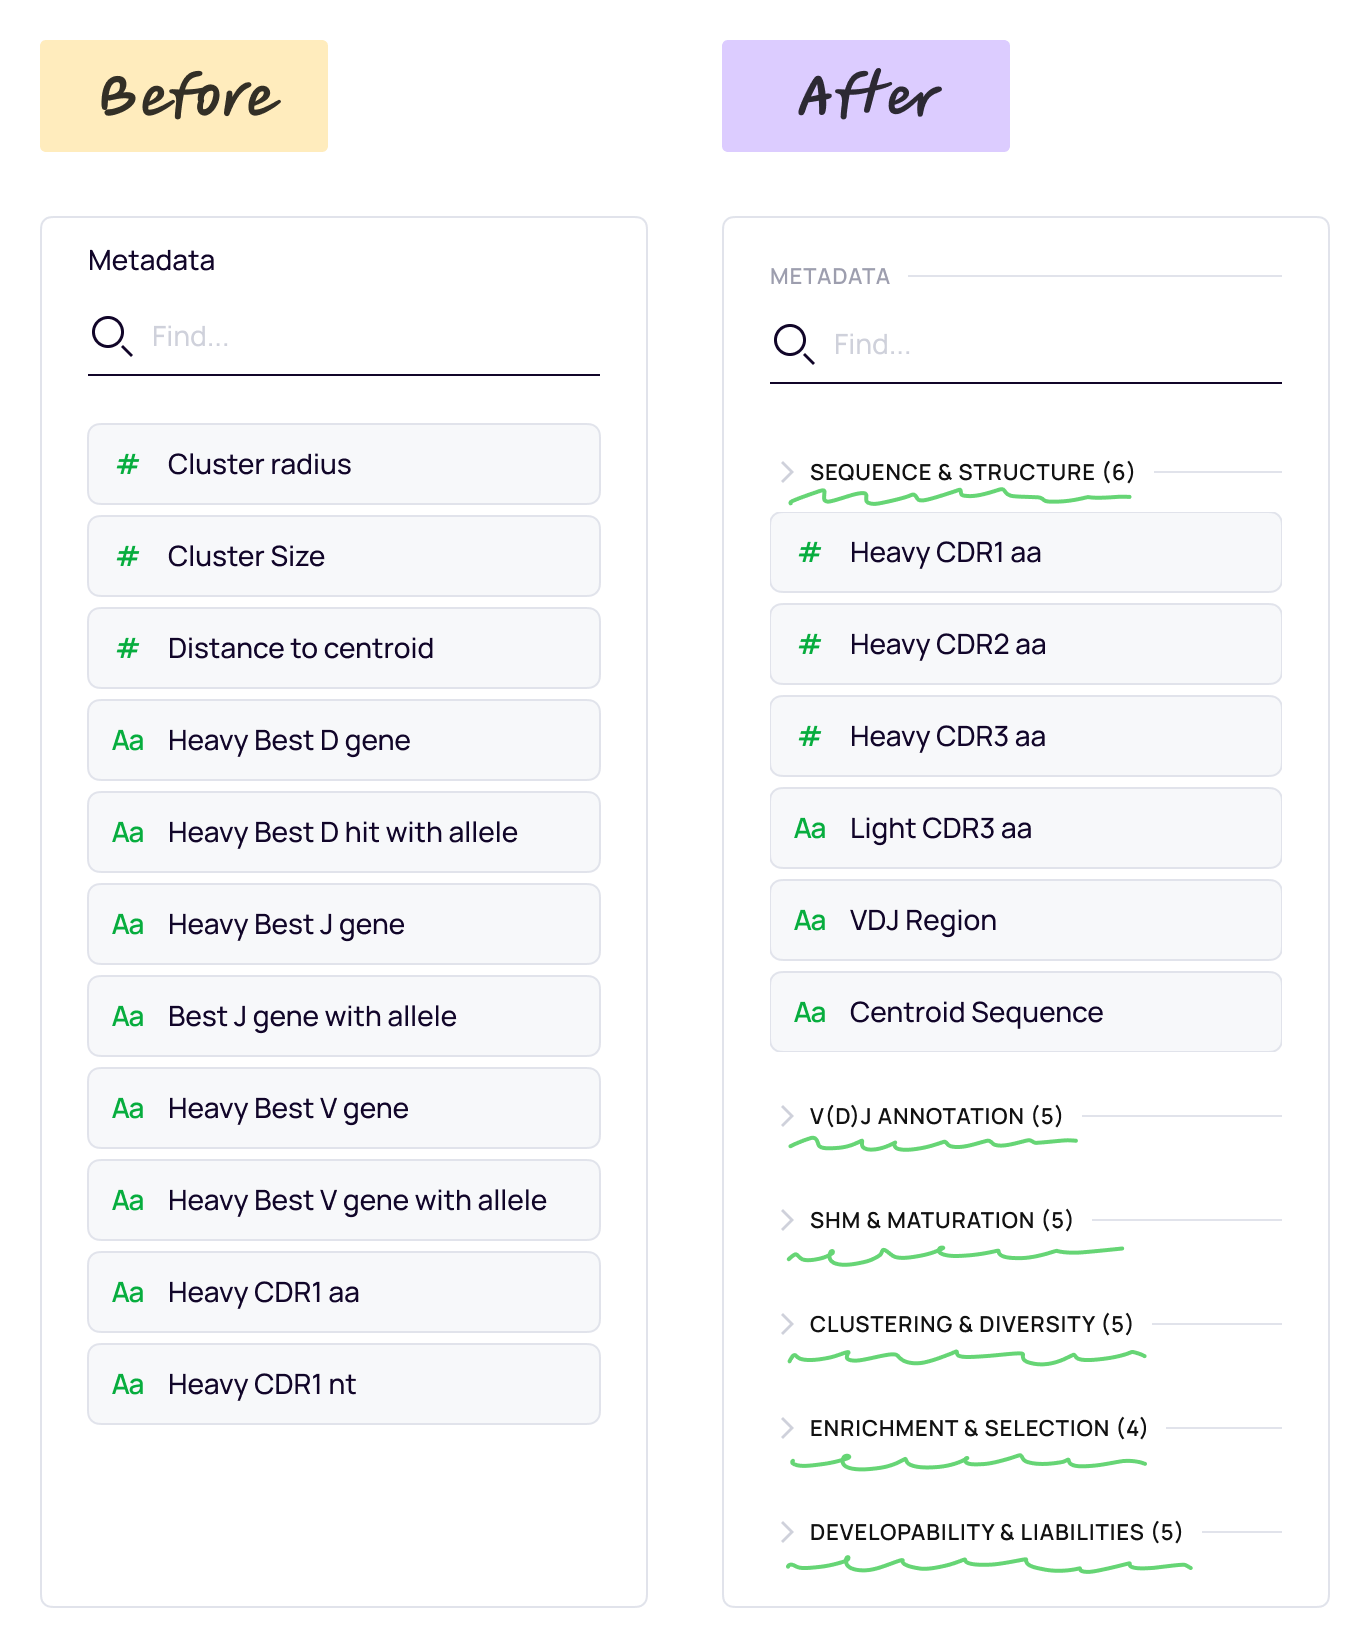
I worked with the CTO on how biologically meaningful groups would be formed through Platforma’s underlying algorithms. Engineers explained the existing compatibility rules, and we reviewed the proposed interface behavior together.
Showing compatibility before users commit to an action
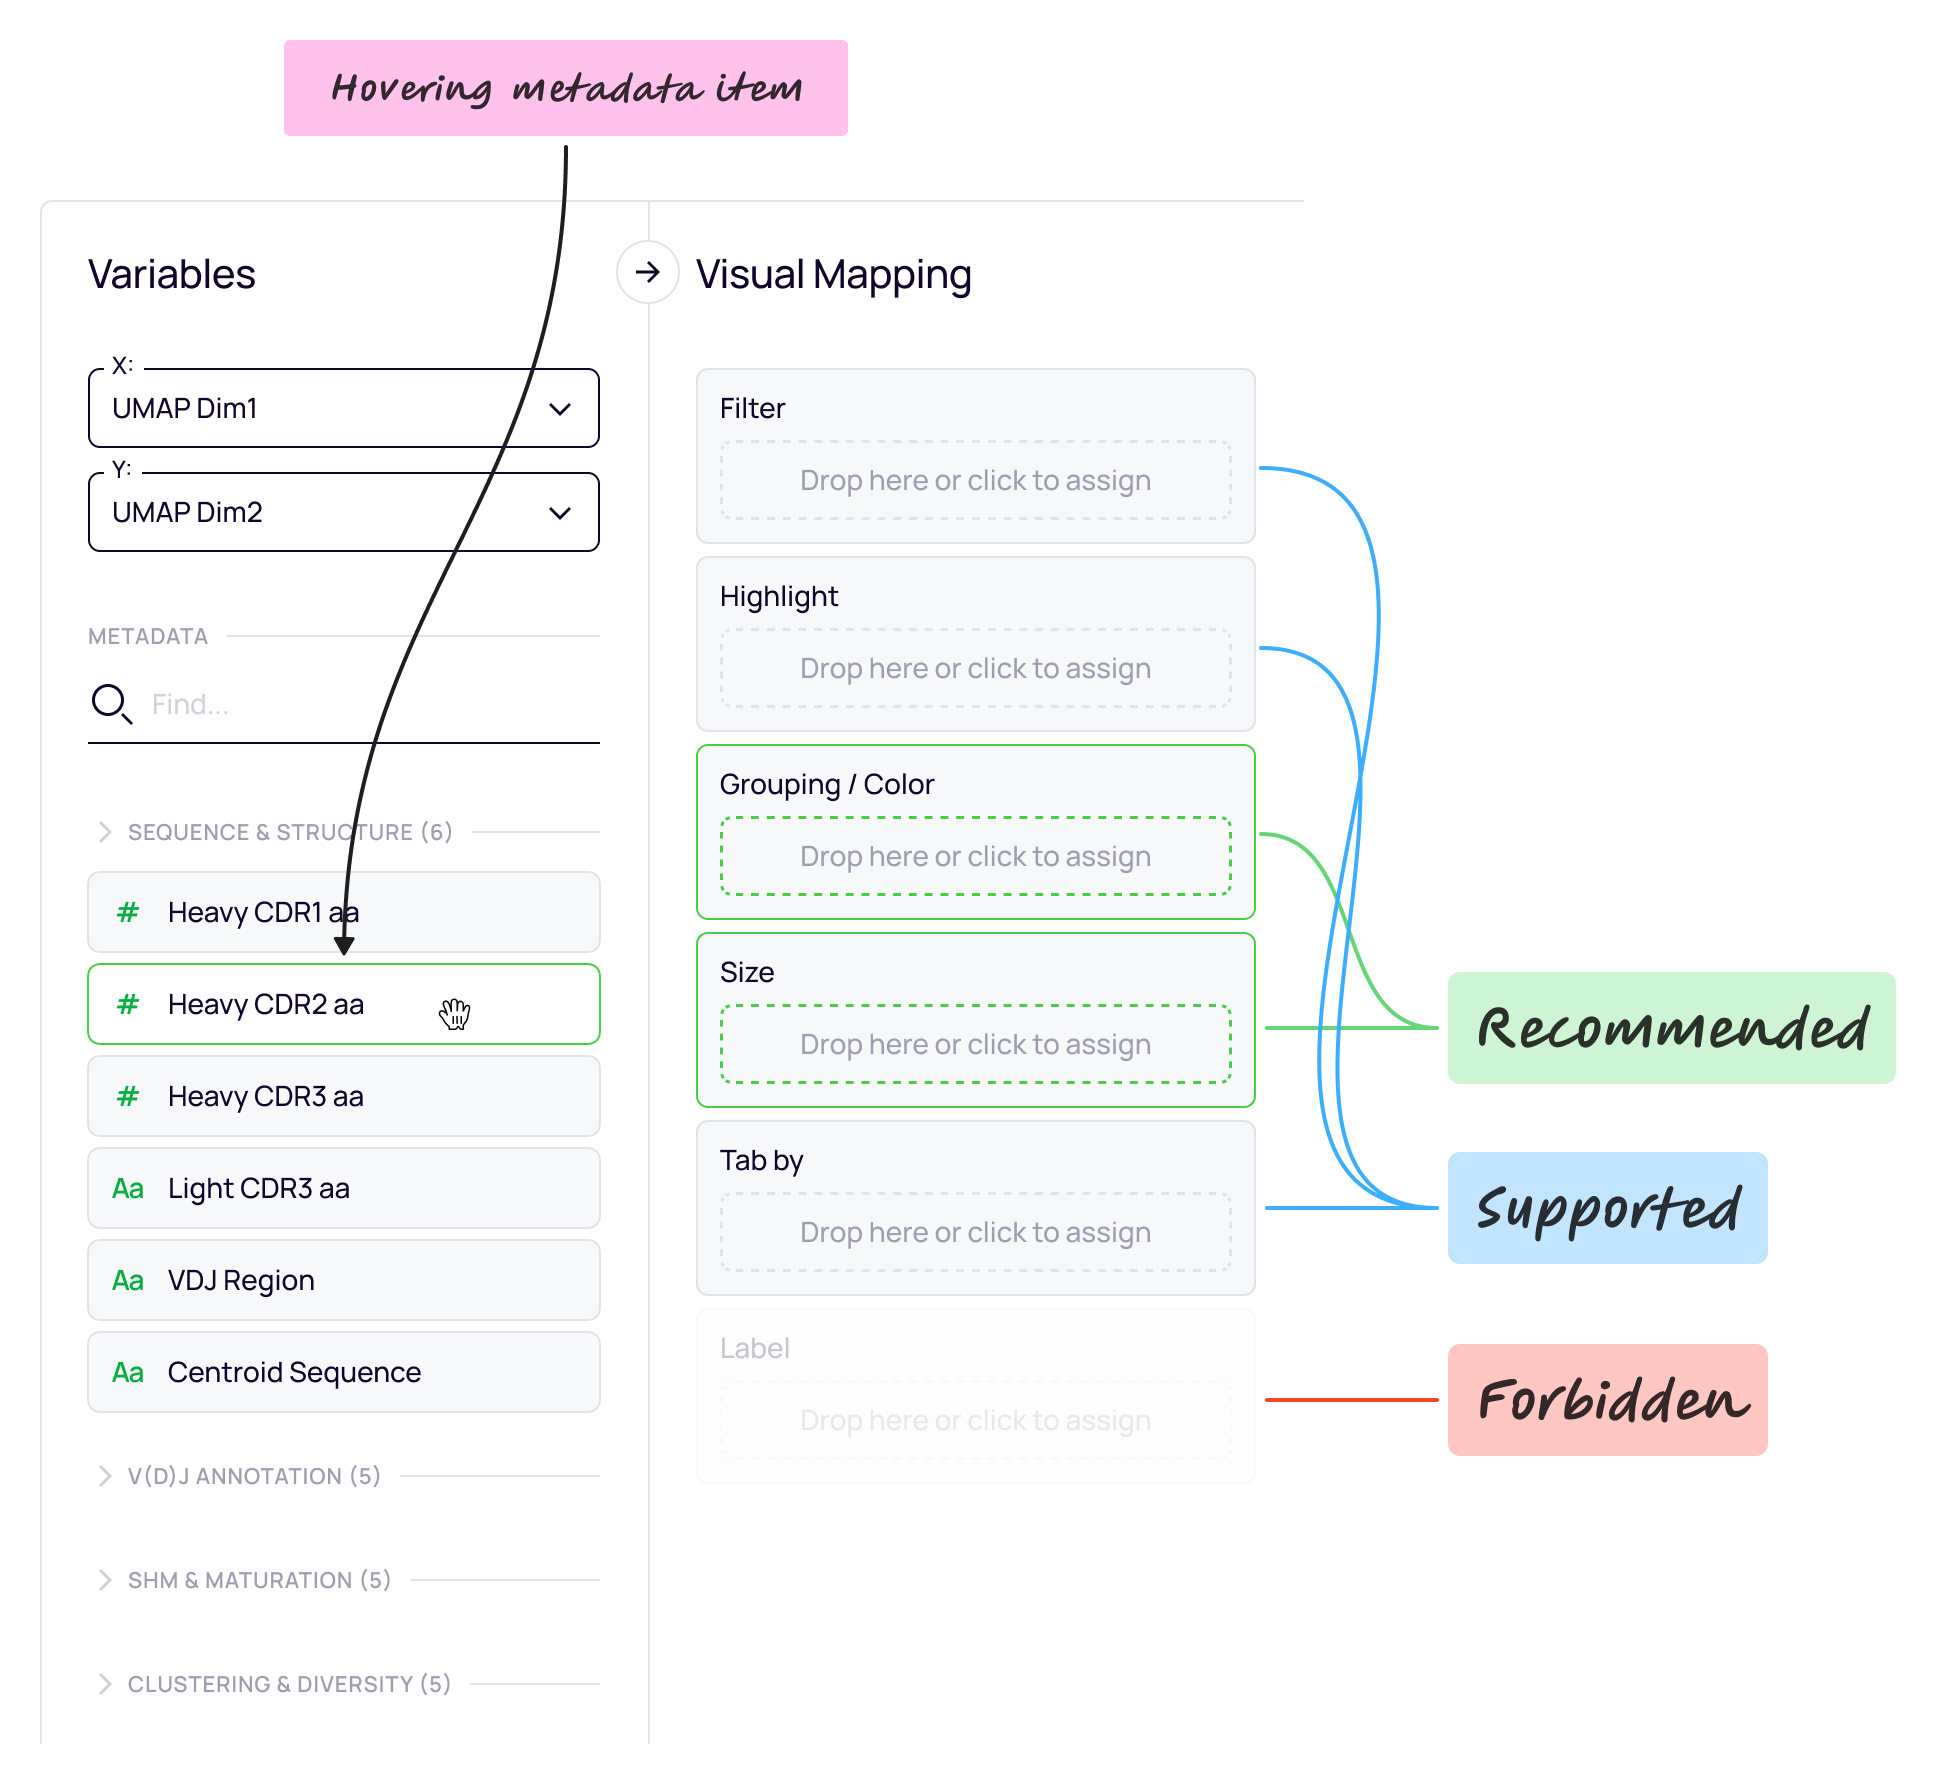
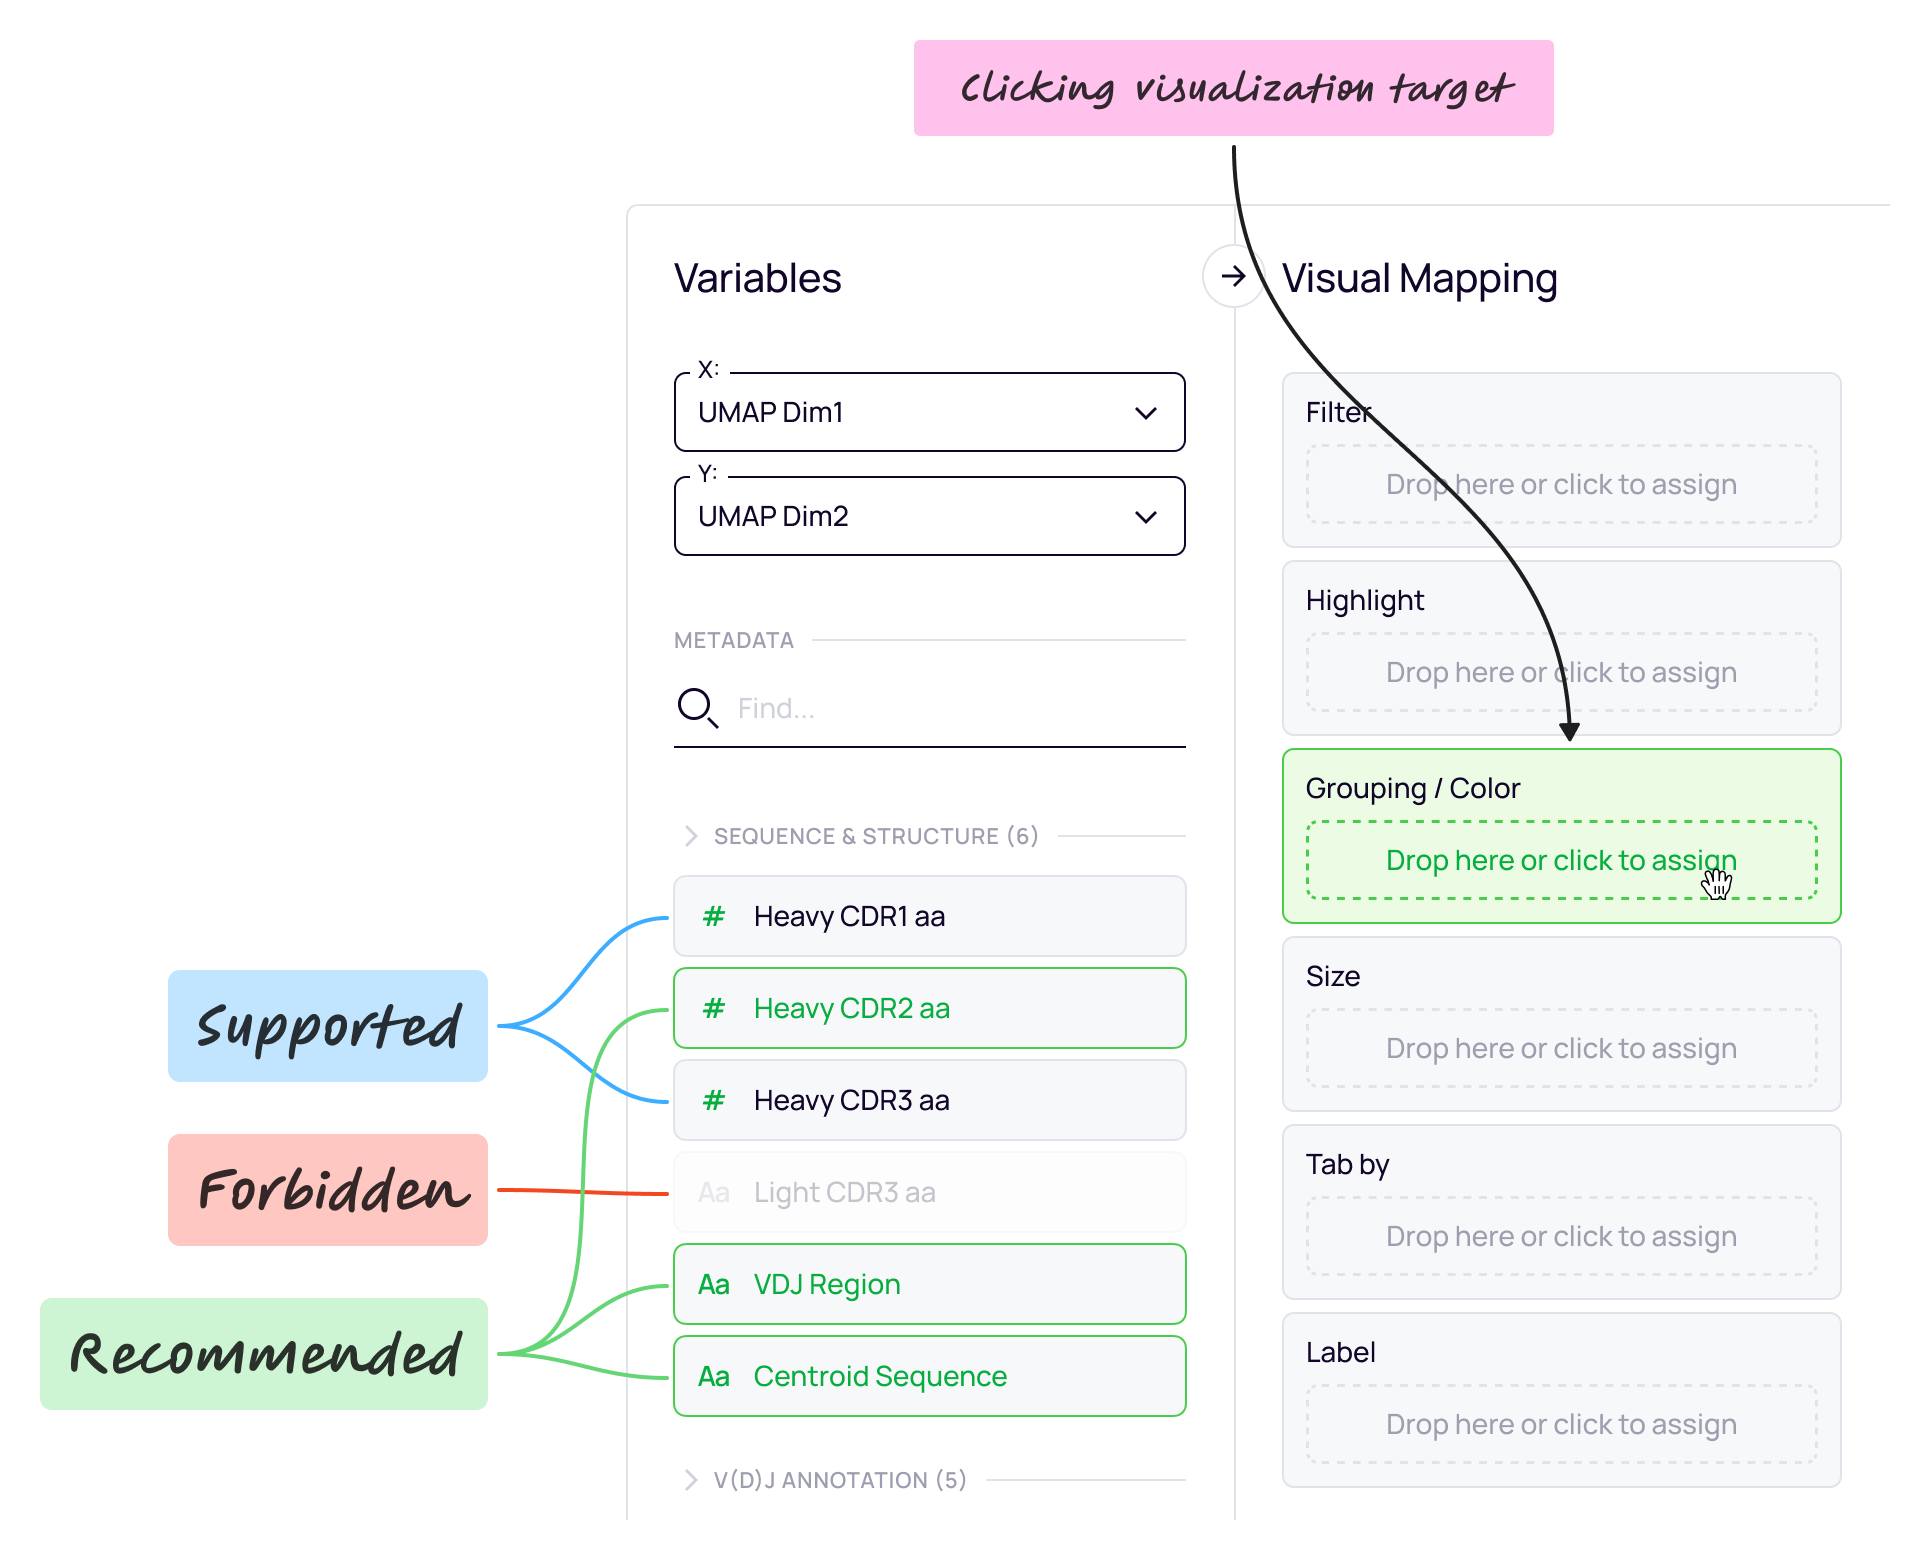
I introduced guidance in both directions. Hovering over a variable highlighted compatible visualization targets. Selecting a target showed which variables were recommended, supported, or forbidden for it.
This supported two starting points: a researcher could begin with the variable they wanted to explore, or with the visualization property they wanted to configure.
Revising the model after scientist feedback
My initial proposal highlighted recommended mappings and disabled all others. Feedback from internal scientists showed that this was too restrictive: a mapping could be technically valid without being useful for the current analytical goal. I revised the model to keep those choices available and distinguish three states:
- Recommended
- Highlighted as appropriate for the current analytical goal.
- Supported
- Technically valid and still selectable, although generally unhelpful for the current analytical goal.
- Forbidden
- Unavailable because the attachment was technically unsupported.
A proposed next step: contextual suggestions
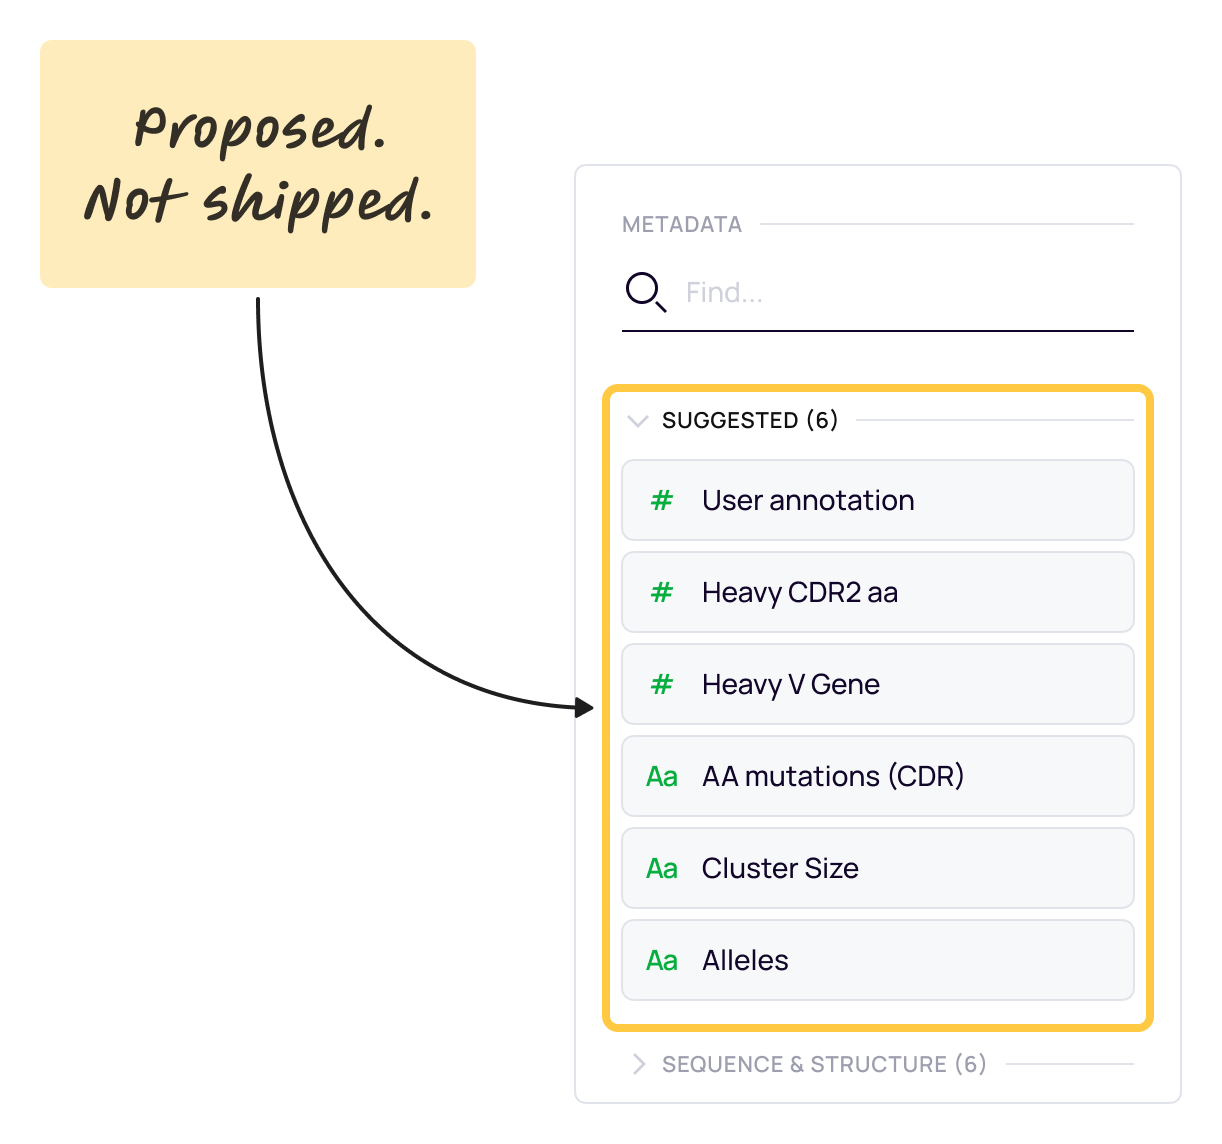
I also proposed a Suggested metadata group that would surface relevant variables based on the blocks in a project and their configuration. This extension remained planned when I left and was not part of the shipped redesign.
Delivery and observed results
Metadata grouping and compatibility highlighting shipped in the next release. I reviewed the implementation and worked with engineers on interaction corrections.
In sessions presenting the redesign to users who had struggled with the previous version, I observed less hesitation during configuration. Customers described the experience as easier and faster, while feedback from colleagues and support records indicated fewer mapping-related complaints.
These were encouraging signals from guided sessions and support feedback; task completion time was not measured. To evaluate the improvement more rigorously, I would measure completion time and task success for representative mapping tasks.