Data mapping
Context
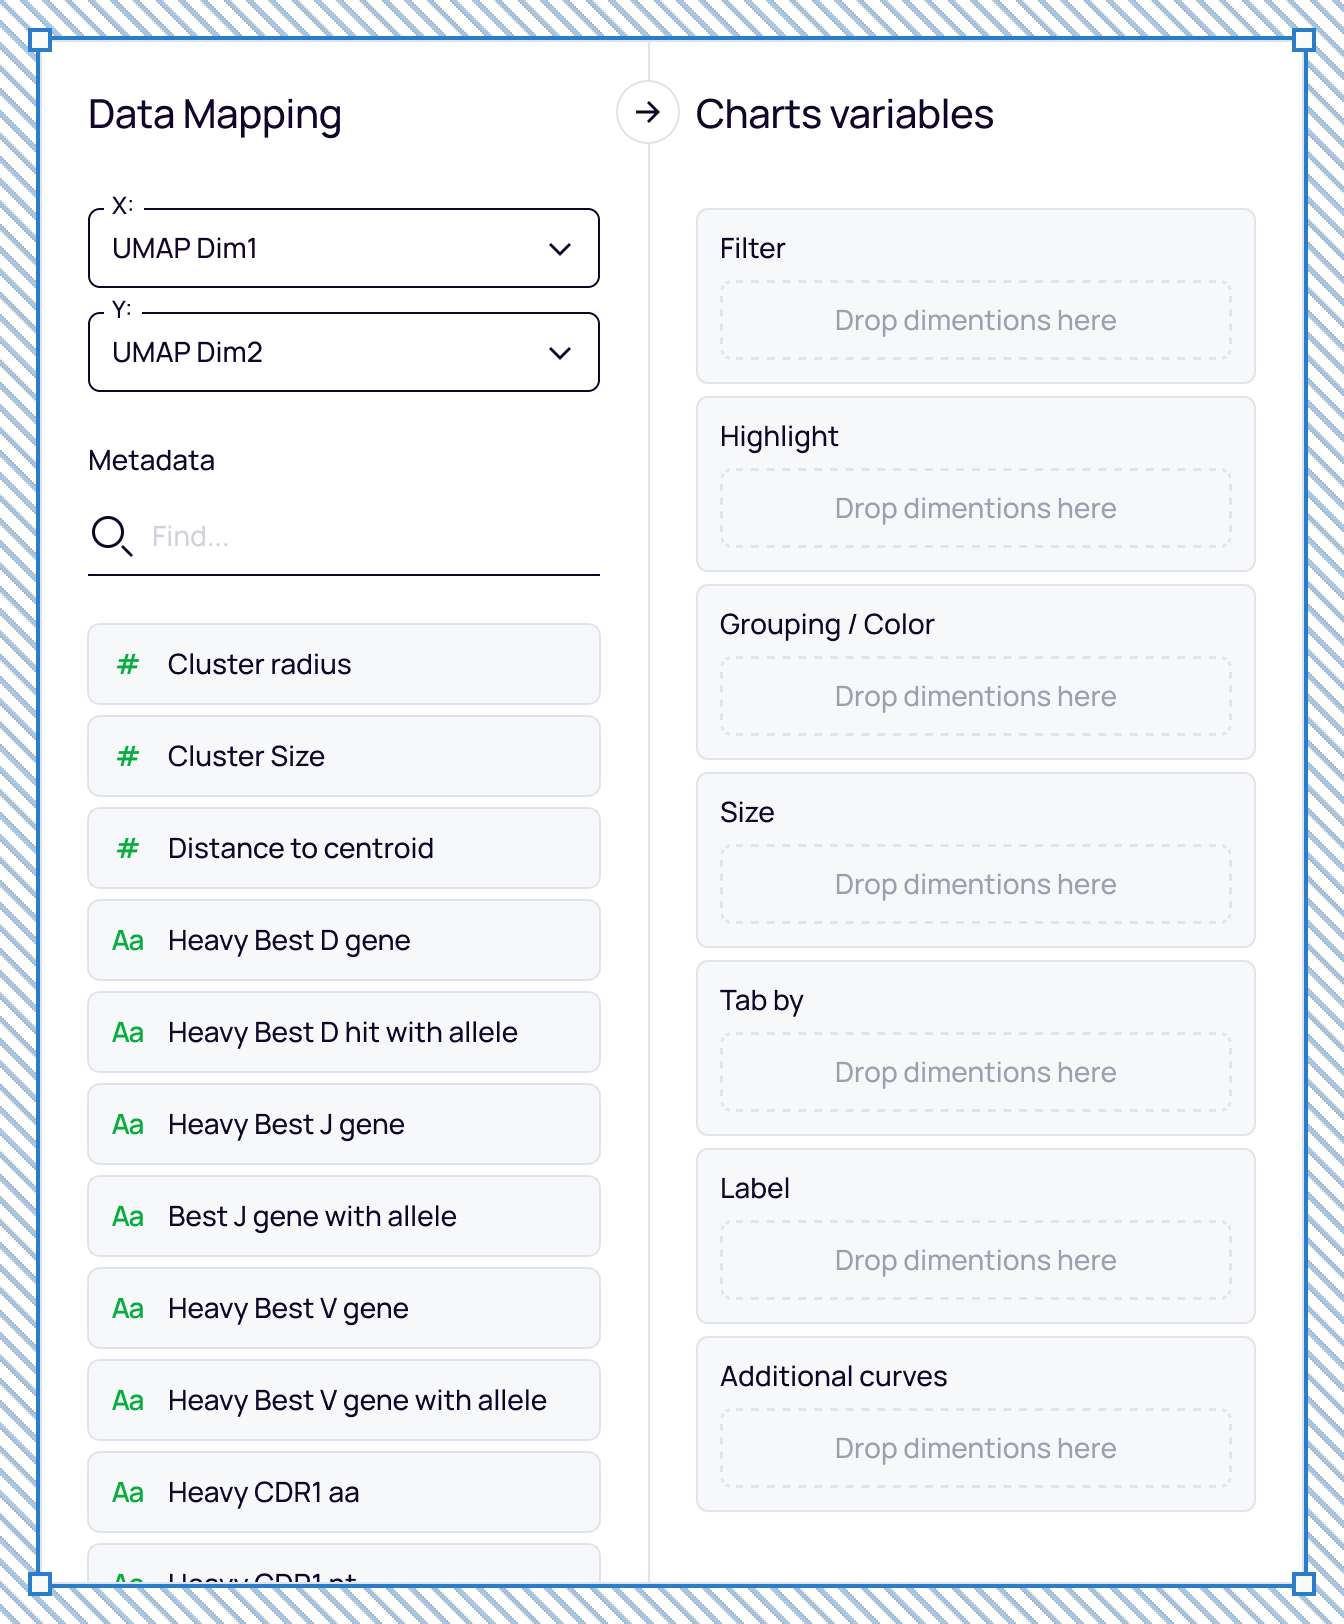
Data Mapping controls what information appears on visualizations and how it is represented. Users connect metadata to chart variables before analysis can begin.
Insights
The redesign was informed by recurring feedback collected through customer webinars, one-on-one discussions, and support requests.
Key themes included:
- Difficulty discovering relevant metadata.
- Uncertainty about variable compatibility.
- High effort required to configure visualizations.
Challenge
As the number of available metadata fields grew, finding the right variables and understanding compatibility rules became increasingly difficult.
Rather than simplifying the workflow by removing functionality, I focused on making complexity easier to navigate. The redesign was guided by four principles: discoverability, guidance, clarity, and flexibility.
The original flow required users to make several interdependent decisions across metadata selection, compatibility, grouping, and visualization targeting.
The redesign brought those decisions into a more guided structure by:
- separating the workflow into clearer stages;
- introducing contextual suggestions;
- making compatibility visible before users committed to a choice;
- clarifying the relationship between source variables and visualization targets.
Key improvements
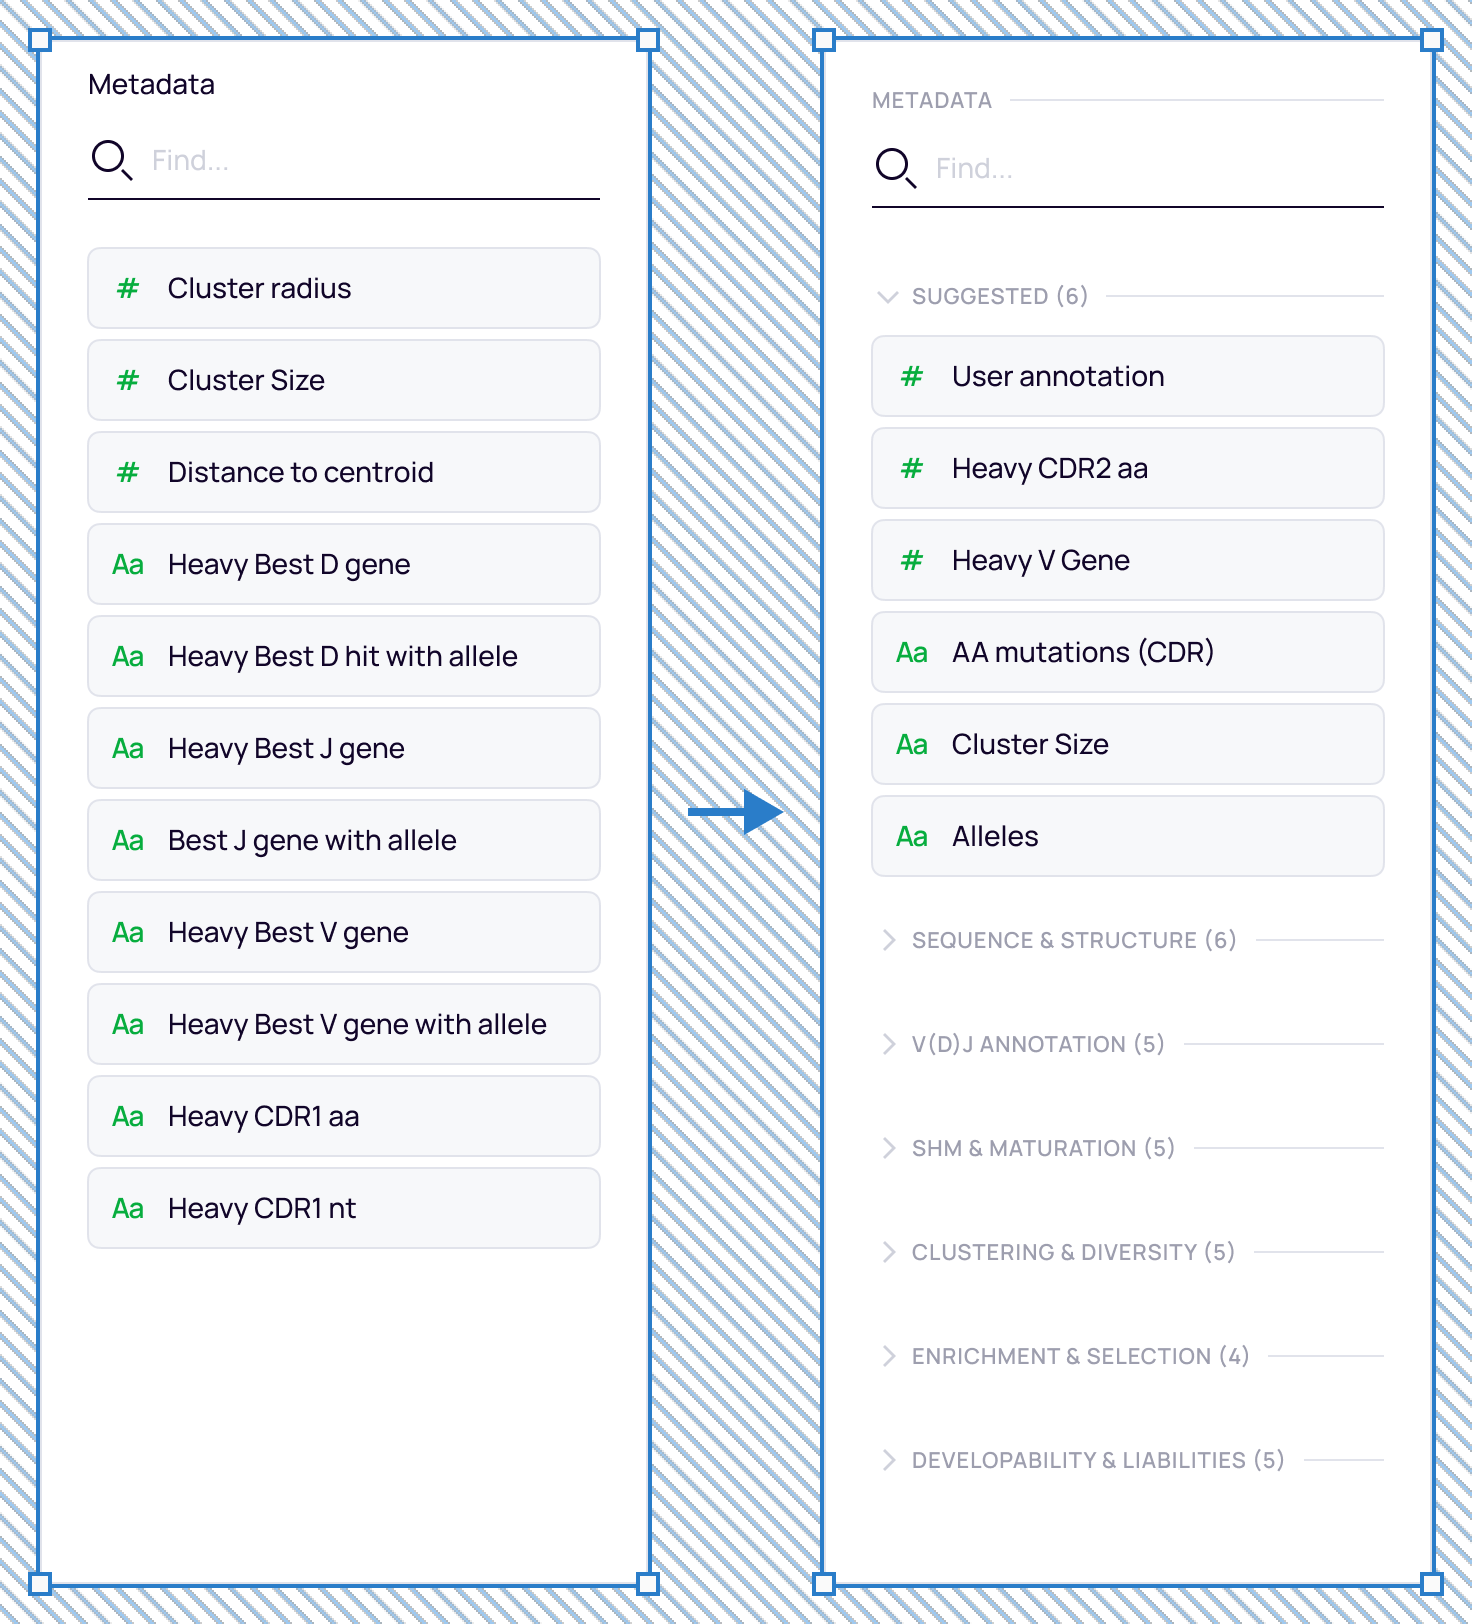
Faster discovery
Organized variables by biological meaning rather than presenting a flat list.
Examples:
- Sequence & Structure
- V(D)J Annotation
- SHM & Maturation
- Clustering & Diversity
Intelligent compatibility guidance
Introduced bidirectional guidance between metadata variables and visualization targets.
The redesign consolidated several previously fragmented decisions into one guided workflow, reducing the need to move back and forth between disconnected configuration states.
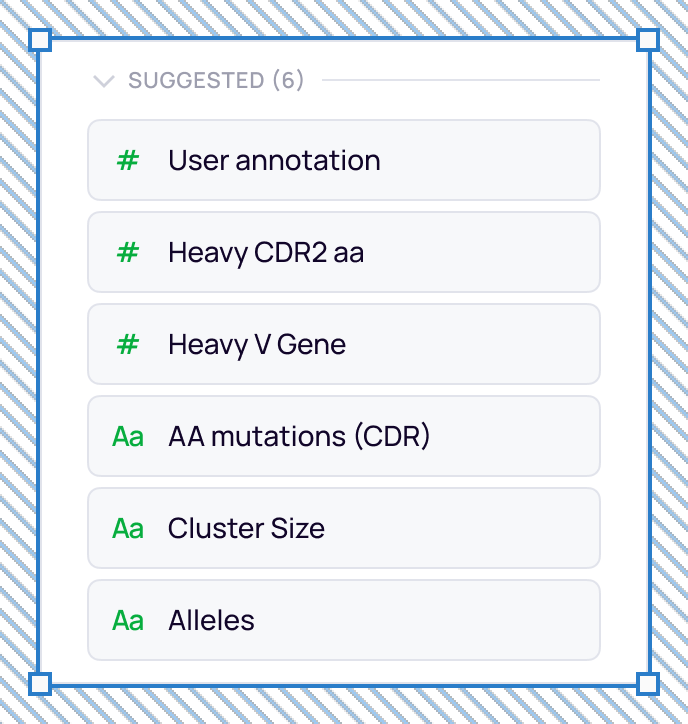
The interface introduced contextual suggestions directly inside the mapping flow, so users could evaluate likely groupings without leaving the task or reconstructing relationships manually.
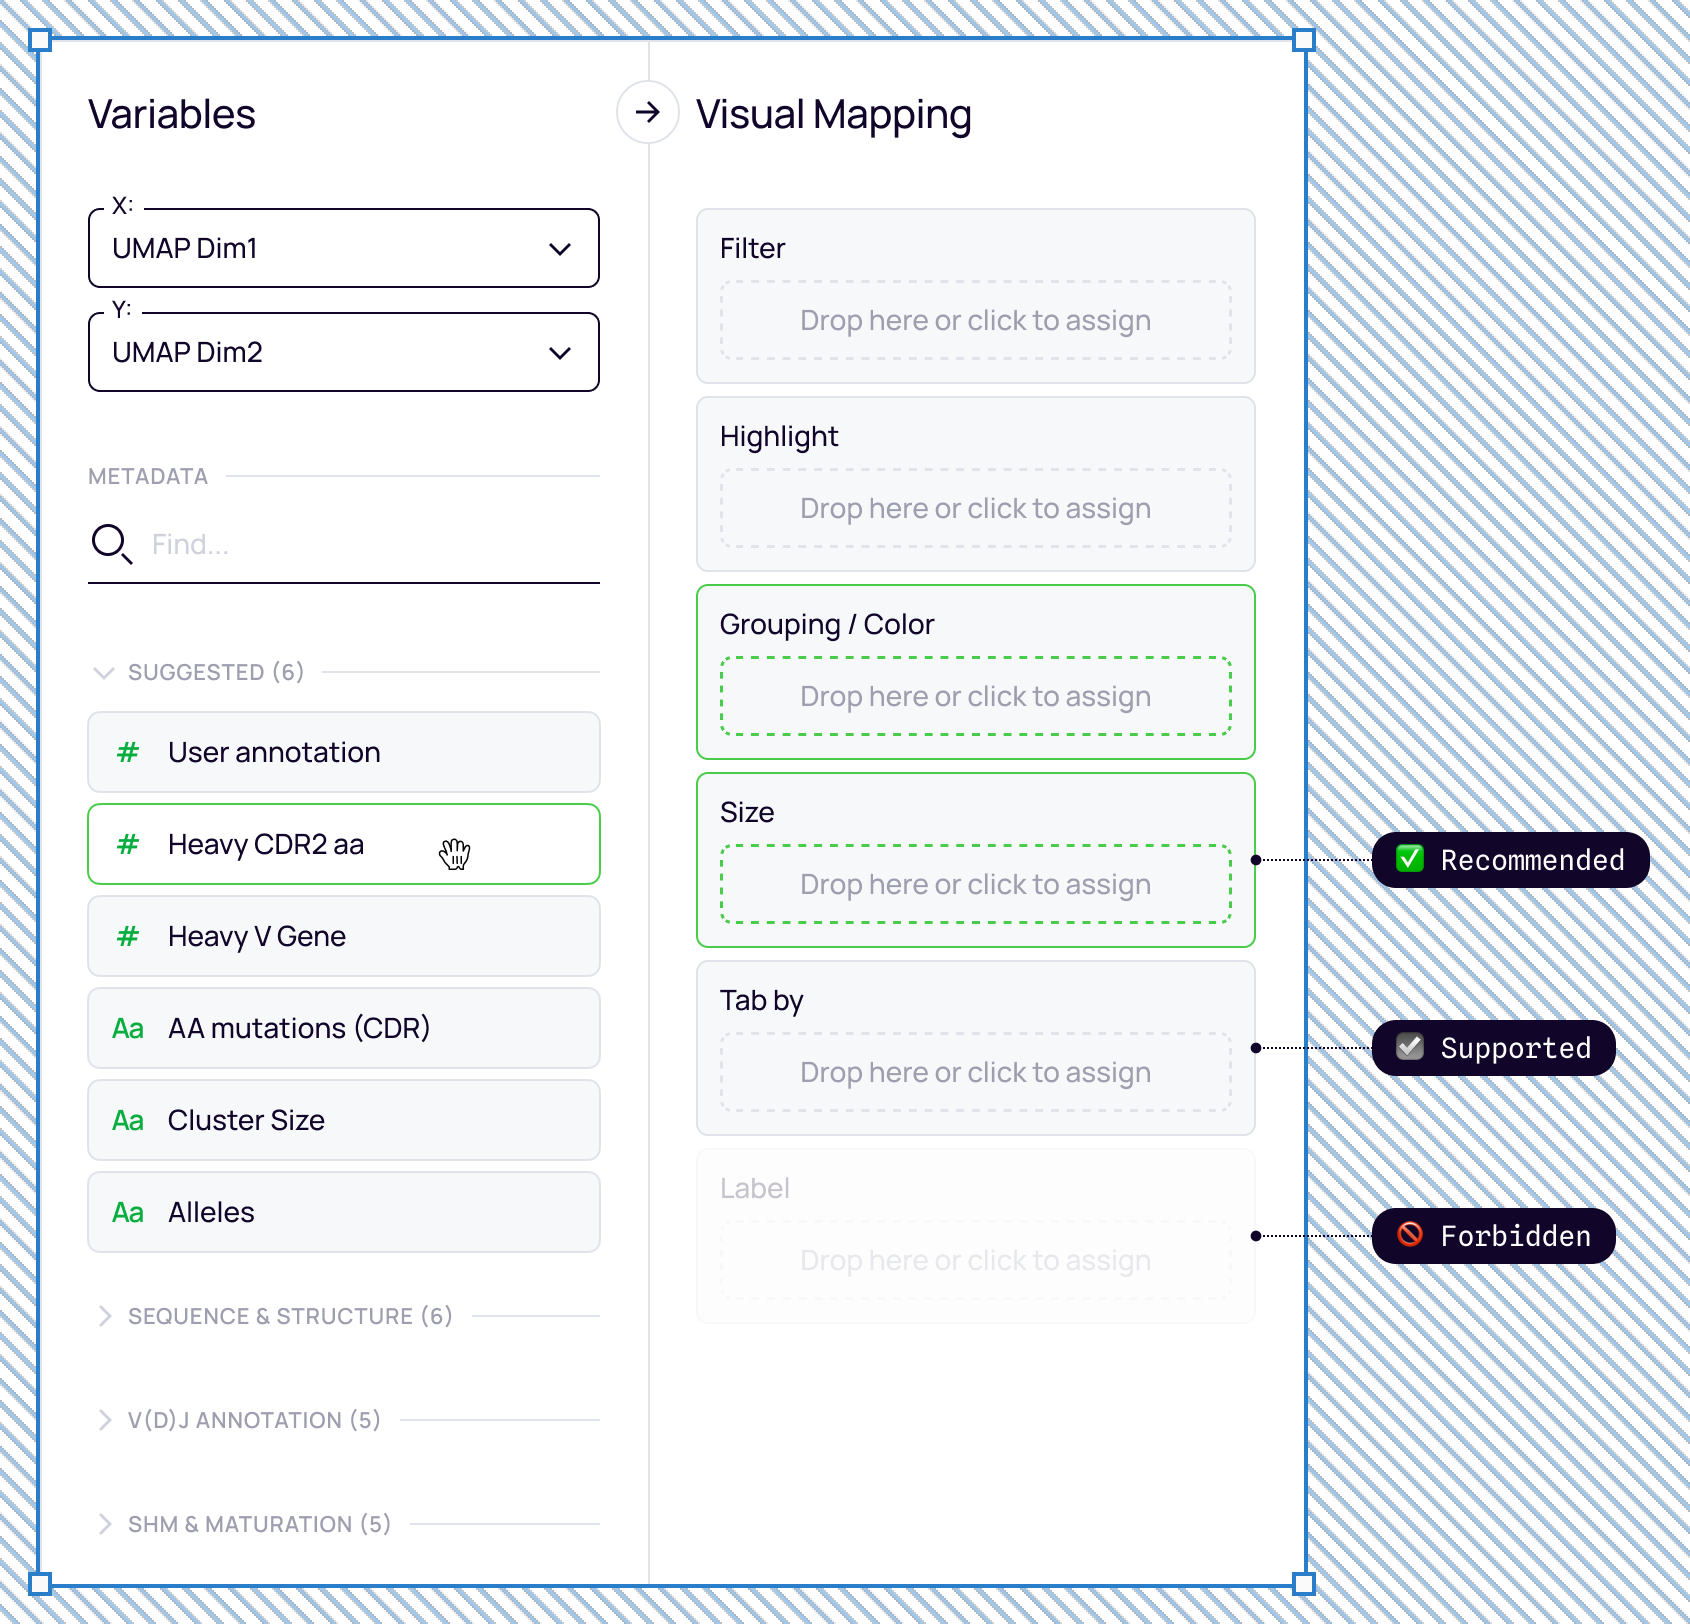
- Hover a variable → compatible targets are highlighted.
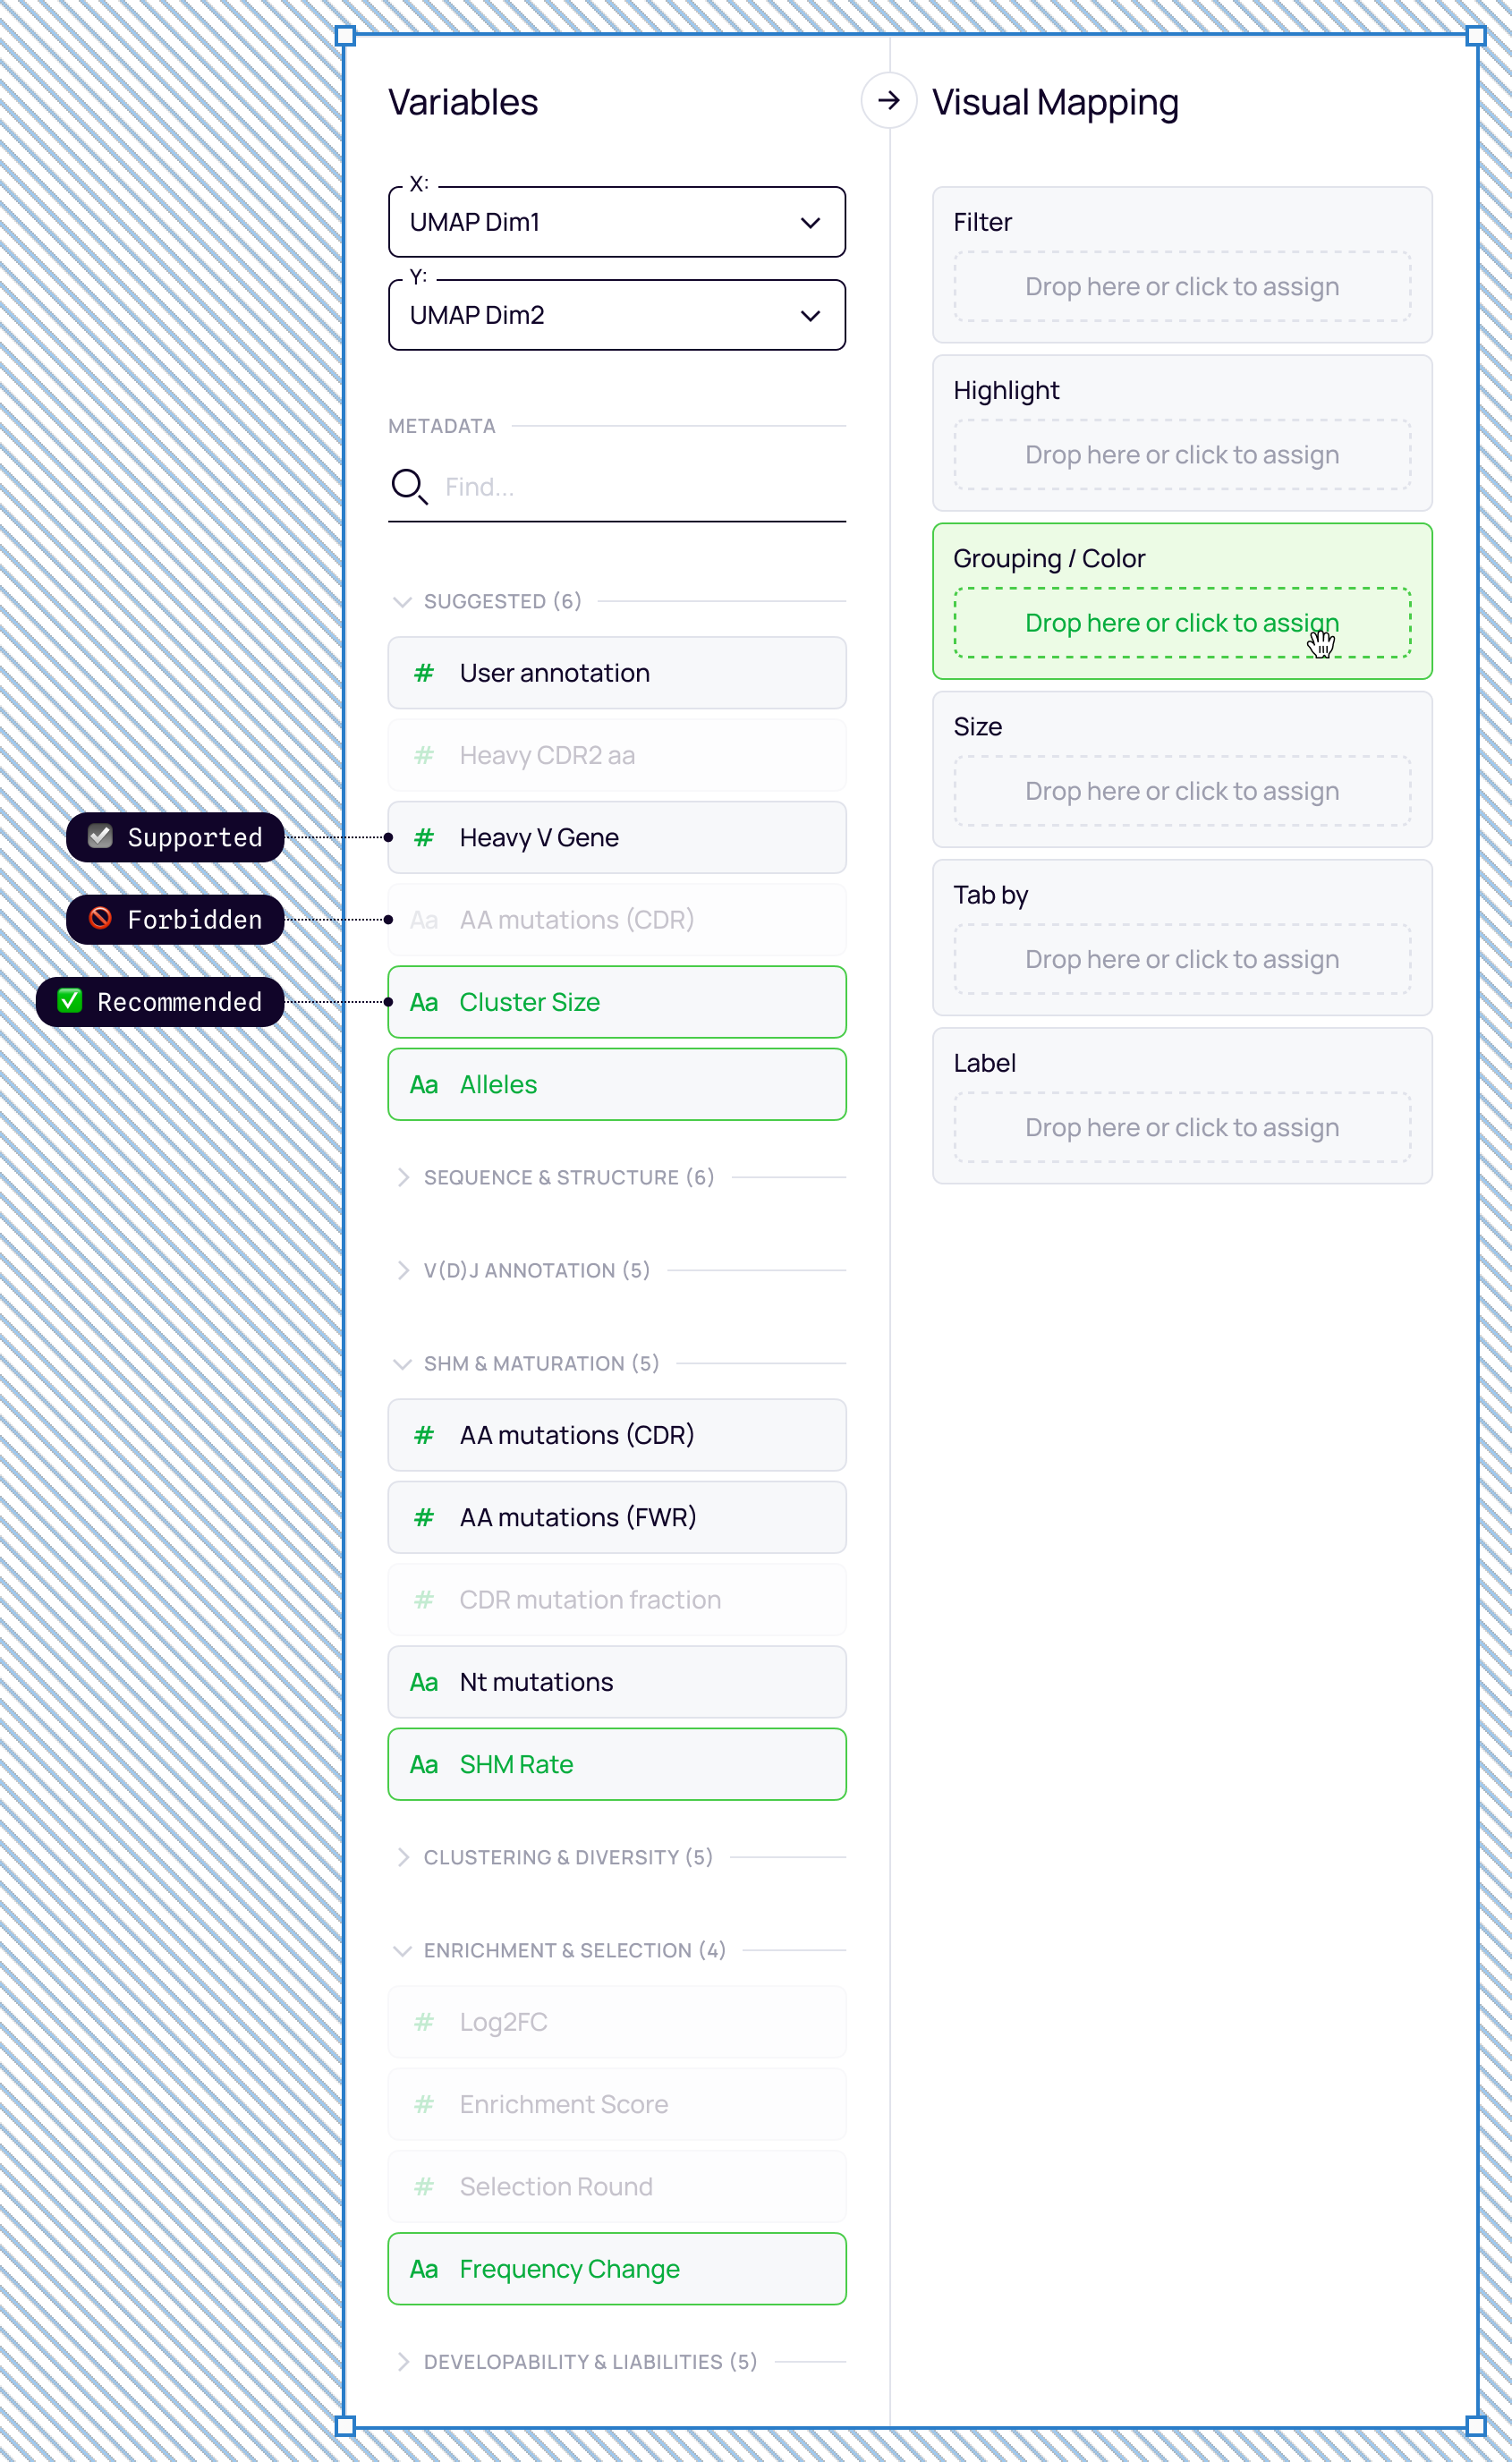
- Select a target → compatible variables are highlighted as Recommended, Supported, or Forbidden.
Suggested Variables
Surfaced the most relevant variables to help users get started faster.
More Explicit Actions
Changed ambiguous drag-and-drop instructions into clearer guidance.

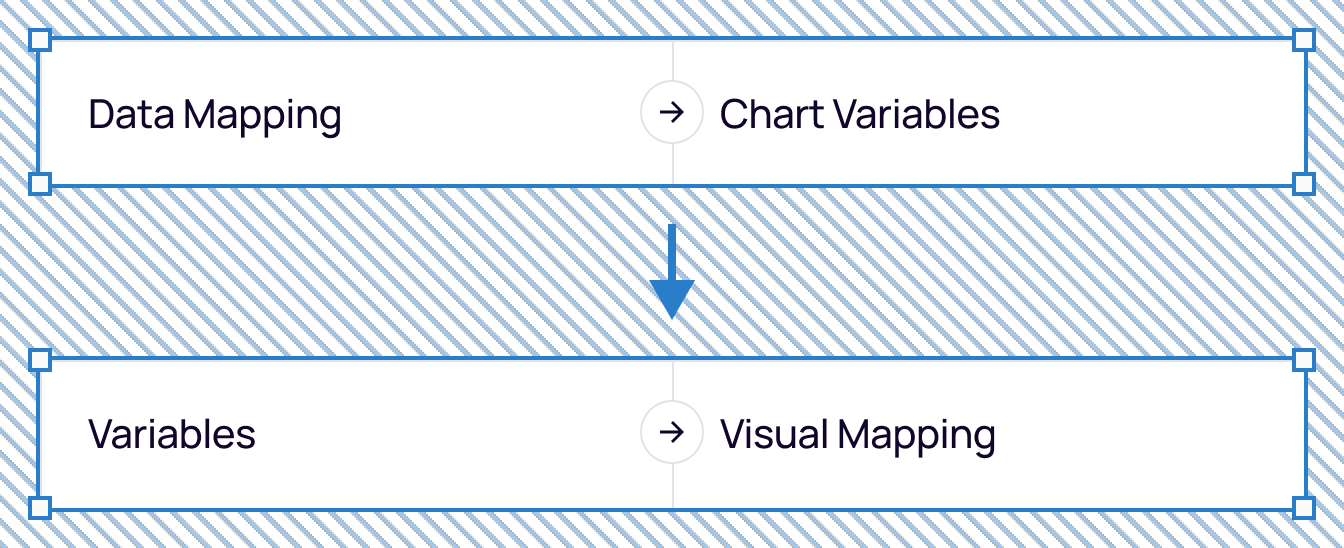
Clear mental model
Renamed technical labels to better reflect user goals.
Before:
- Data Mapping
- Chart Variables
After:
- Variables
- Visual Mapping
My role
Led the redesign end-to-end, from problem discovery and workflow architecture to interaction design, information architecture, and validation.
Outcome
The redesign transformed Data Mapping from a fragmented configuration task into a guided workflow.
The new experience:
- organized metadata around biologically meaningful groups;
- introduced contextual suggestions and explicit compatibility guidance;
- clarified the relationship between source variables and visualization targets;
- reduced the need to navigate between disconnected configuration states.
The result was a workflow that gave researchers more guidance without removing the flexibility required for complex analytical work.